Learn more about the new Defensive Pressure Score.
While defense has been measured via traditional counting stats (blocks, steals, deflections) for decades, there is much more to defense besides what may show up in a box score.
On any given play, an offensive player may choose not to drive because of a defensive player waiting in perfect help defense position. A defensive player may blow up a screen, disrupting an offense’s intended action. A defense may leave a shooter wide open daring them to shoot. In short, defense is about the amount of pressure the defensive players do – or do not – put on various players.
What if there was a way to quantify the pressure that each defensive player applies on each offensive pressure 60 times per second? With the help of advanced optical tracking systems and cutting-edge AI, that’s the objective of the Defensive Pressure Score.
The foundation of any model is the data that goes into it. That’s where the NBA’s optical player tracking systems come in. Using advanced 3D pose detection models, these systems track 29 points on each player’s body with sub-centimeter accuracy, generating 3D coordinates for every movement. All of this is captured 60 times per second. Despite capturing many joints, Defensive Pressure Score currently utilizes only a player’s center of mass coordinates.
Defensive Pressure Score Overview
Defensive Pressure Score measures the pressure that each defensive player applies to each offensive player, regardless of whether these players are matched up with each other. Defensive Pressure Score utilizes math to quantify defensive principles into subcores that are then aggregated into one final Defensive Pressure Score. It is worth noting that a higher Defensive Pressure Score doesn’t necessarily mean better defense. For instance, it is easy to imagine a play where the ball handler is double teamed, but his teammate is wide open under the basket. While the ball handler is under a significant amount of defensive pressure, a well-executed pass should lead to an easy bucket.
Subscores
Defensive Pressure Score is broken down into seven subscores with various weights applied to each score. Here’s the breakdown:
- Absolute Distance: Distance between each offensive and defensive player
- Relative Distance: Distance from defender to offensive player adjusted by the distance the offensive player is from the basket
- Passing Lane: Distance a defender is to the natural passing lane adjusted for the distance the offensive player is from the ball. The closer the defender is to the passing lane, the greater the impact on defensive pressure for this subscore. The Passing Lane subscore is not calculated while the ball is in the air (pass or shot) or when the offensive player is the ball handler
- Basket Line: Distance from defender to the basket line (line between the two baskets) with a penalty added for a defender being further from the basket than the offensive player
- Players Between: Penalty score is added if there is an opposing player between the offensive and defensive player (i.e. an offensive player who could act as a de facto screener)
- Speed Difference: Absolute value of the speed difference between the offensive and defensive player
- Movement Direction: Difference between the offensive and defensive player angles multiplied by a speed multiplier (if both players are going the same speed in the same direction, there will be a greater Defensive Pressure Score)
Additional Factors:
Following the calculation of each subscore, the subscores are then weighted and combined, and the final product is smoothed over a short window of frames to produce Defensive Pressure Score. Finally, an optimization algorithm determines the defensive matchups that maximize total team defensive pressure. These are the matchups that are used to build our Defensive Box Score.
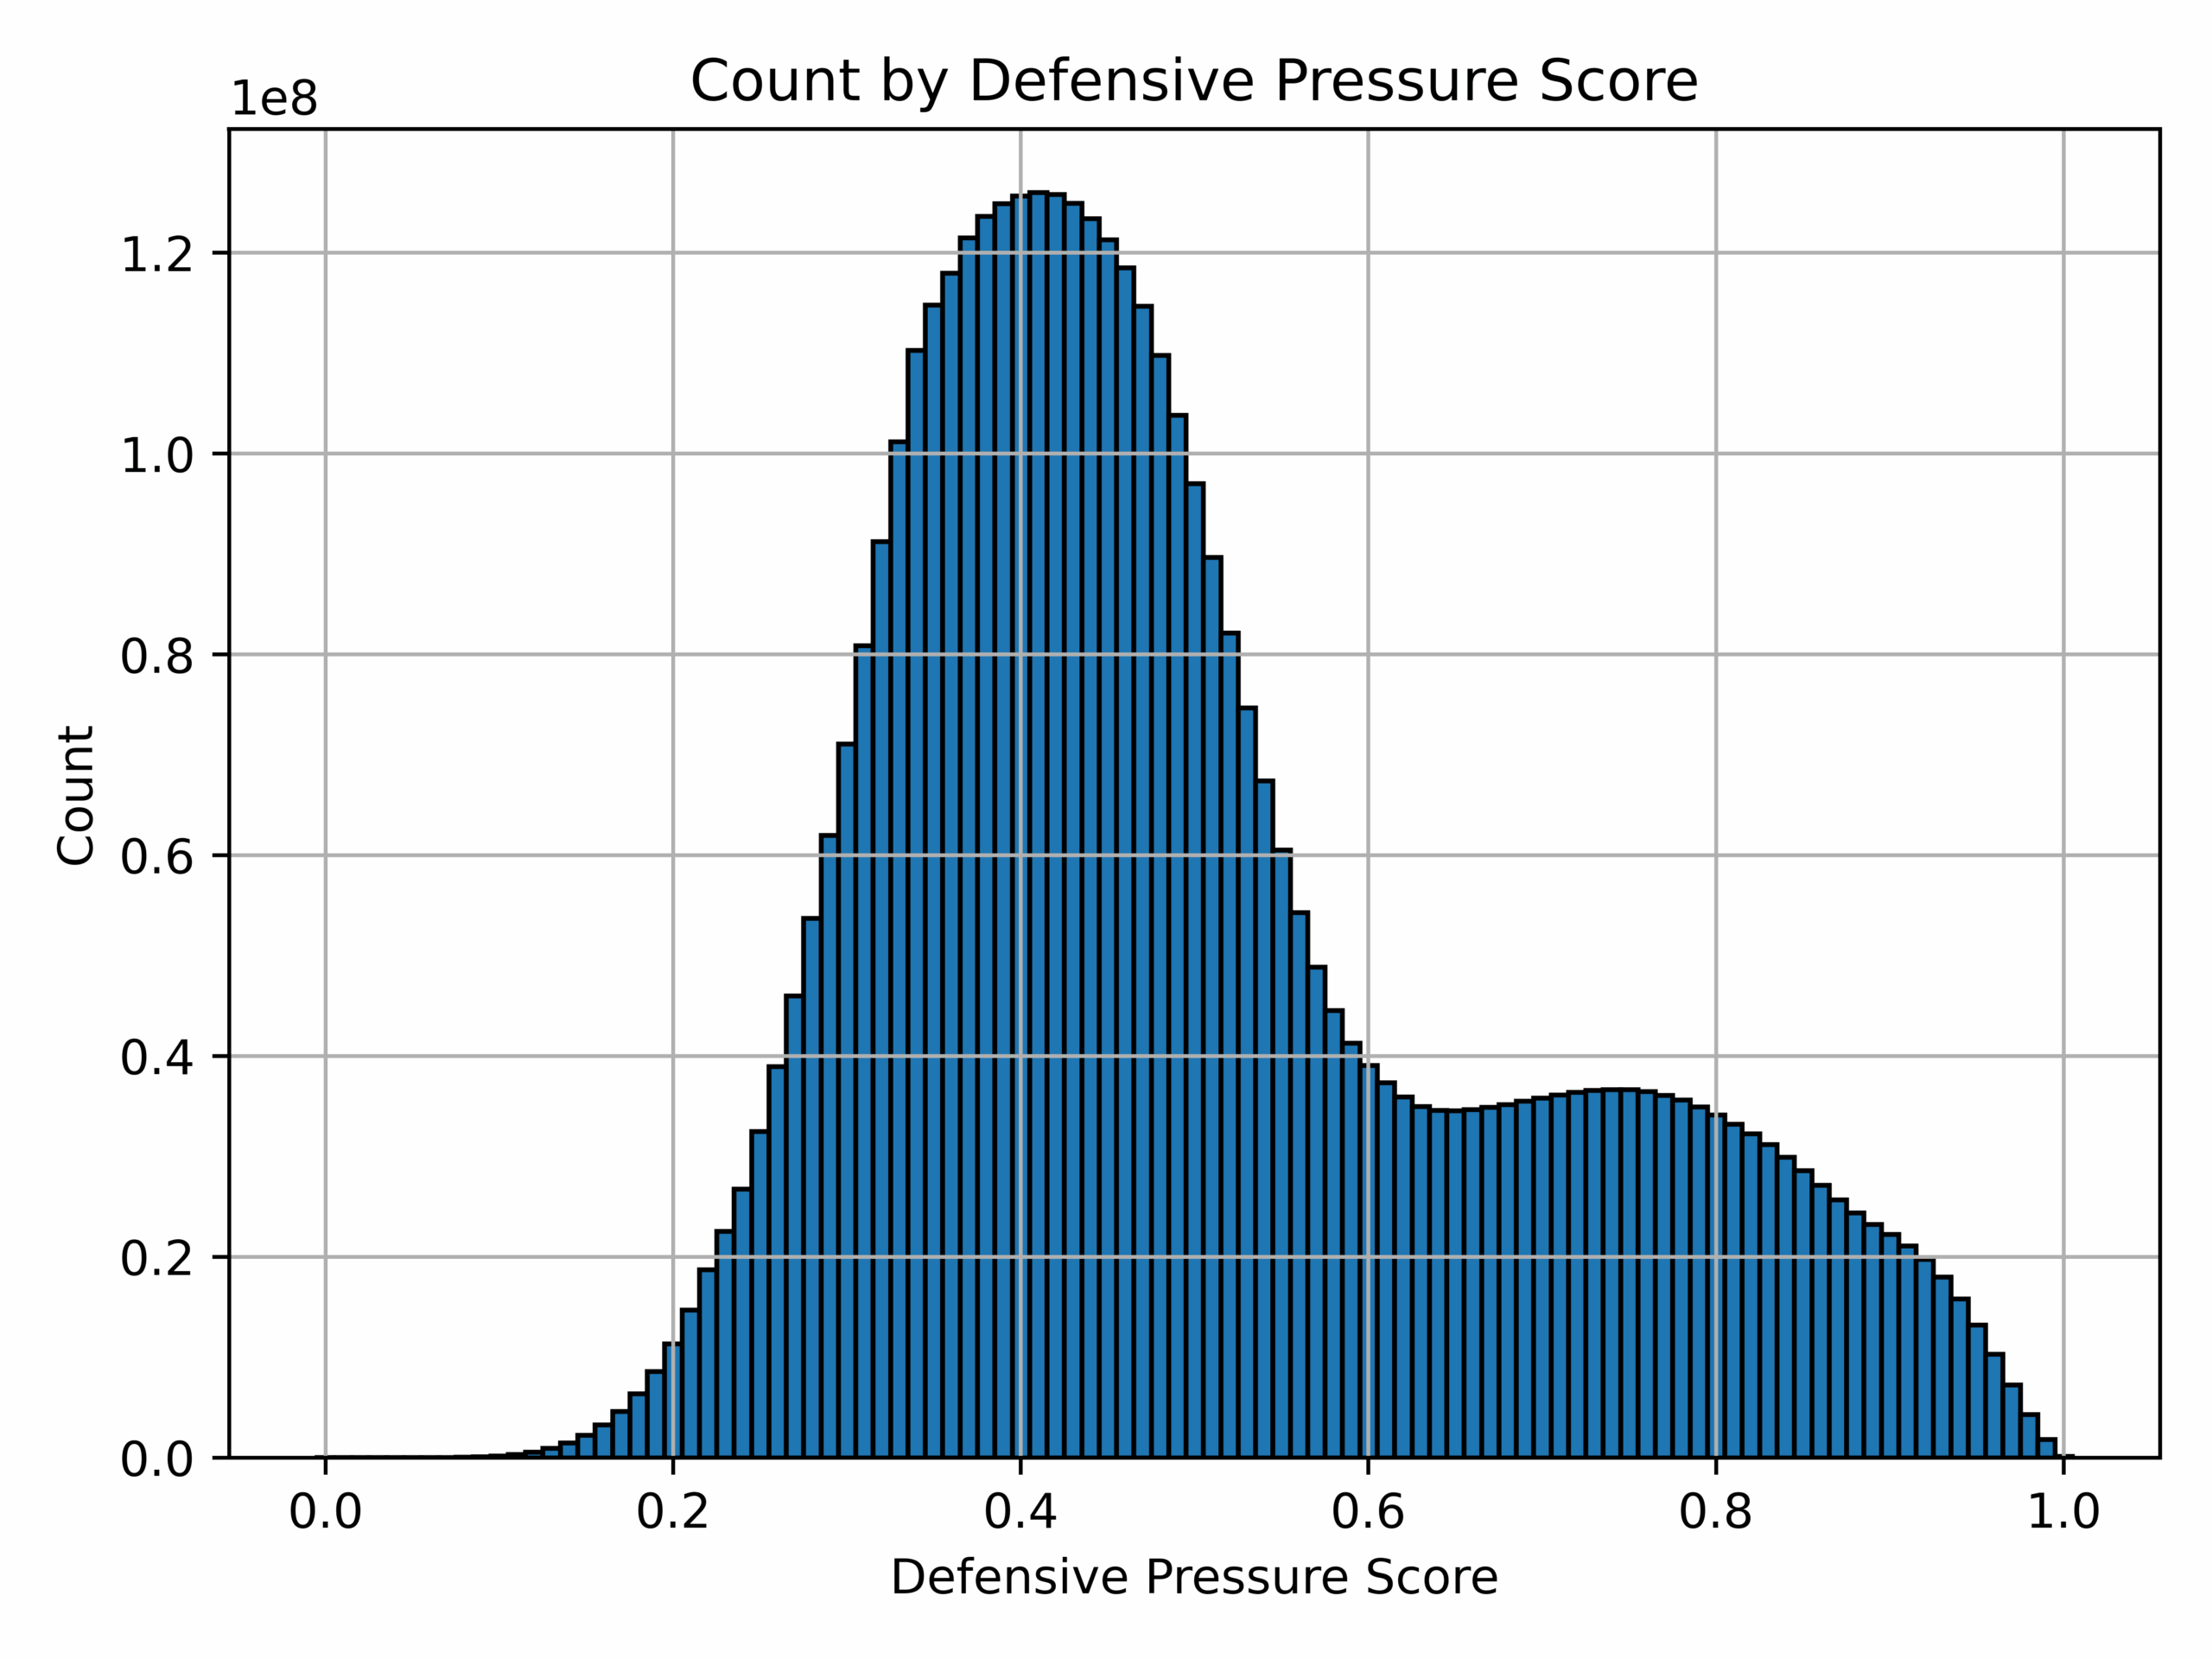
Overall Scoring Distributions:
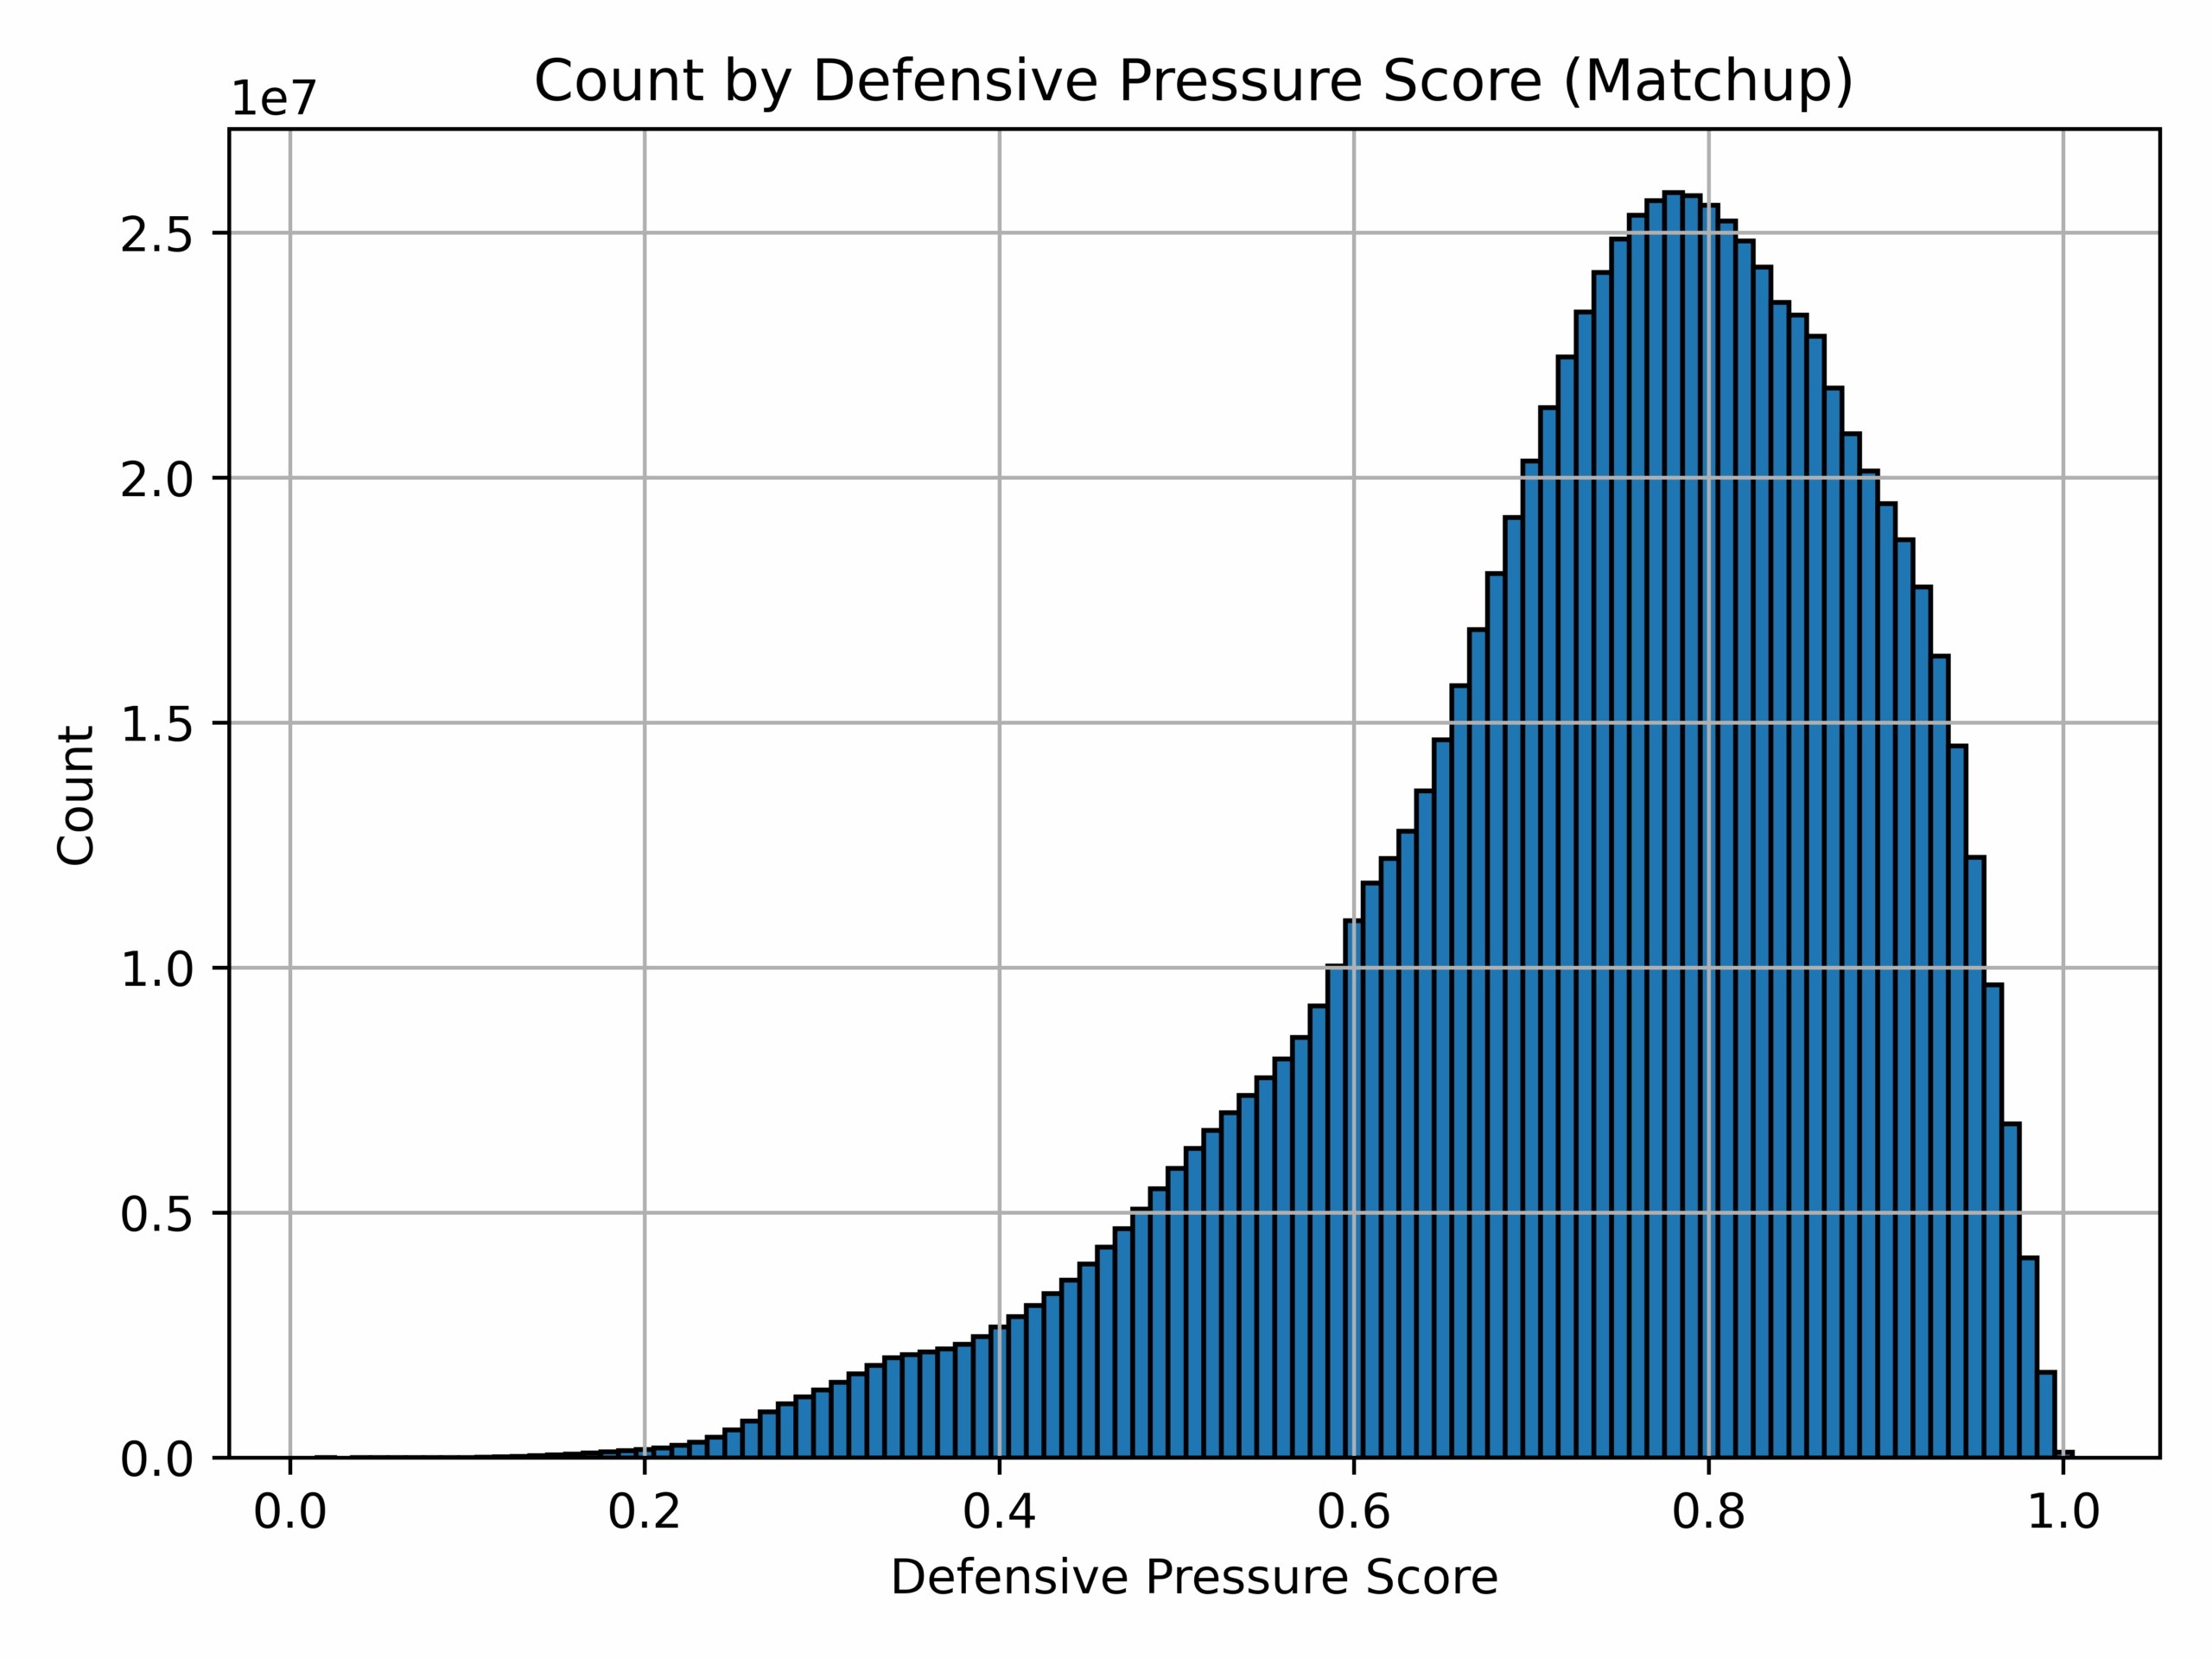
With 25 scores (combination of five offensive players and five defensive players) every 60th of a second, there is a wide range of Defensive Pressure Scores. Defensive Pressure Score falls on a 0-1 range and the below histogram displays the distribution for both general Defensive Pressure Scores and scores based on an offensive player’s particular matchup.
The second hump in the overall count of Defensive Pressure Score is caused by players who are matched up to their offensive player. As seen in the 2nd histogram, if an offensive player is a particular defensive player’s primary matchup, that Defensive Pressure Score is on average significantly higher (in the 0.6 to 1 range) than non-matchup Defensive Pressure Scores.